
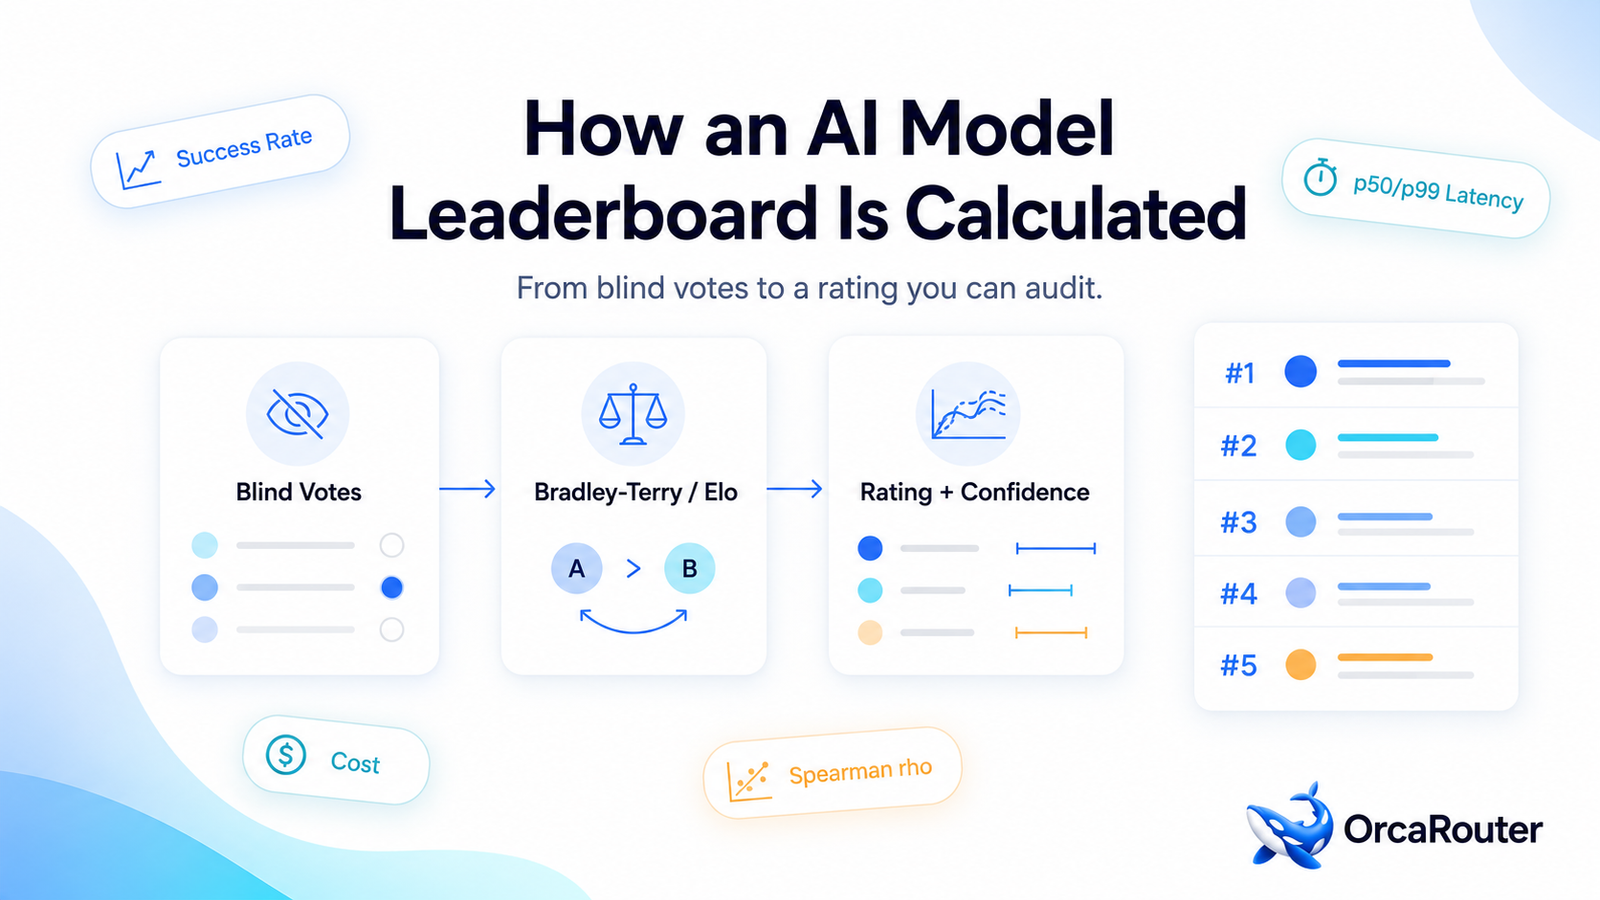
The number under each model on an AI model leaderboard isn’t a guess it’s the output of a specific statistical recipe. Understanding that recipe is the difference between a ranking you can trust and one that’s just a popularity contest. Modern boards like OrcaRouter build their standings from two ingredients — blind community votes and real production traffic and then check the result against independent rankings.
This article opens the hood on a live AI model leaderboard: how votes become a Bradley–Terry (Elo) rating, how reliability is scored from live traffic, and how a board proves its ranking against the outside world.
The raw material: two kinds of data
Every credible leaderboard starts with measured evidence, from two main sources.
Preference data comes from head-to-head comparisons: two models answer the same prompt and a human votes for the better one. When the vote is blind, the result is remarkably resistant to bias.
Operational data comes from real production traffic: every time a model serves a live request, the system records whether it succeeded, how long it took, and what it cost. This is behavior, not opinion.
The most trustworthy leaderboards use both. The AI model leaderboard on OrcaRouter, for instance, is computed by combining real production traffic with community blind-battle votes — explicitly *not* vendor-reported benchmarks.
Turning votes into ratings: the Bradley–Terry model
Raw votes (“A beat B”, “C beat A”) don’t form a ranking by themselves. The standard method is the Bradley–Terry model, the statistical foundation of the Elo ratings used in chess.
• Each model is assigned a latent “strength” parameter.
• The model estimates those strengths so they best explain the observed win/loss record.
• The resulting rating predicts the probability that one model beats another.
Crucially, the quality of your opponents matters. Beating a top-ranked model moves your rating far more than beating a weak one — so you can’t climb by racking up easy wins.
Why confidence intervals are non-negotiable
A single rating number hides how *sure* the system is. That’s why good leaderboards attach a confidence interval — usually a 95% band — to every rating.
• Narrow band → lots of data, trustworthy position.
• Wide band → few votes, uncertain position.
• Overlapping bands → the two models are statistically tied, regardless of which sits higher.
When two models are within each other’s error bars, treat them as equals and let cost or latency break the tie.
Scoring reliability from production traffic
Over a rolling window — say the last 7 days — the system tallies, for each model:
• Success rate: completed requests ÷ total requests.
• p50 latency: the median response time.
• p99 latency: the 99th-percentile, worst-case response time.
• Error rate: the share of requests that failed.
• Cost per million tokens: separated into input and output pricing.
• Throughput: tokens streamed per second.
These aren’t opinions; they’re logged facts from real usage. A model can have a glittering arena rating and still show an ugly p99 — and the board will show both.
Validating the ranking against the outside world
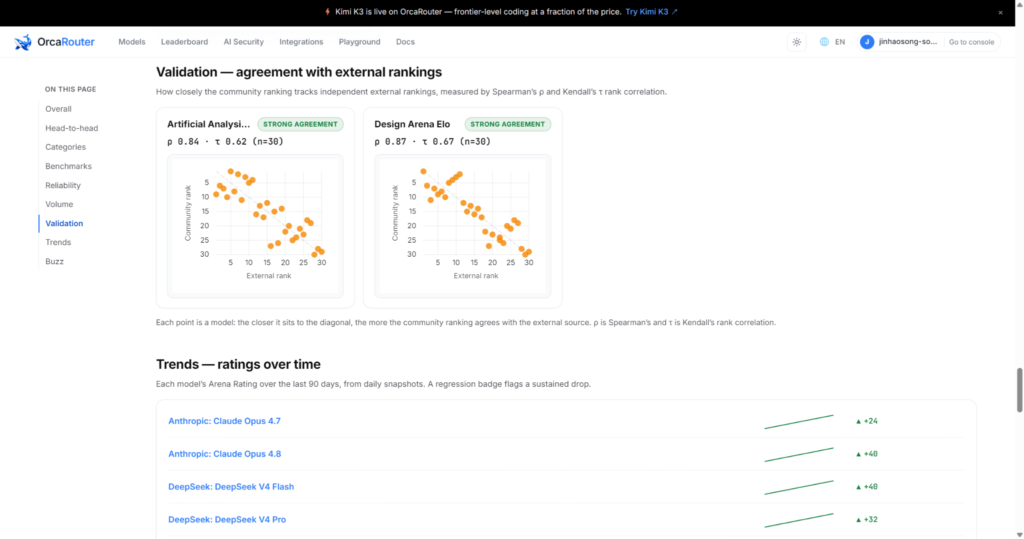
A rigorous board checks itself against independent references using rank-correlation statistics — Spearman’s ρ and Kendall’s τ — which measure how closely two ordered lists agree. Strong correlation with respected sources (like LMArena or Artificial Analysis) is evidence the methodology is sound. A board that publishes these figures is showing its work.
Putting the whole calculation together
1. Blind votes → run through Bradley–Terry → an Arena Rating with a confidence band.
2. Production traffic → aggregated into success rate, latency, cost, and throughput.
3. Rank correlation → a check that the whole thing lines up with independent rankings.
The takeaway
An AI model leaderboard isn’t magic it’s Bradley–Terry math applied to blind votes, joined with hard numbers from real production traffic, and validated against independent rankings. Once you understand how these standings are computed, you can read an AI model leaderboard the way its authors intended: not as a single verdict, but as a transparent, statistically honest picture of a fast-moving field.
